| |
Software
Development
The final design of the data acquisition and control
software was written in C++ using Microsoft Foundation
Classes. The procedure for performing a servovalve test
was made to be intuitive and to require no prior knowledge.
Once the software icon is clicked, a new document is
automatically created and the “New Servovalve
Project” dialog box shown in Figure 15 prompts
the user to enter his or her name and the serial number
of the servovalve. These parameters, as well as the
automatically generated time stamp, will be displayed
on the monitor or any hardcopies.
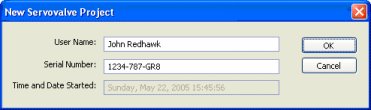
Figure
15. New
Servovalve Project dialog box
The layout of the data acquisition and
control software is shown in Figure 16 and consists
of the main menu, toolbars, and the main working area.
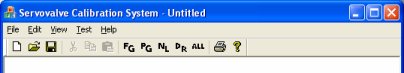
Figure
16. Layout of the data acquisition and control
software
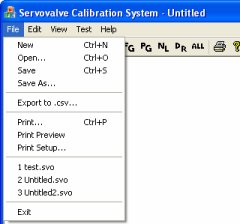
Figure
17. The File submenu
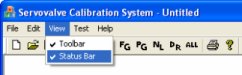
Figure
18. The View submenu
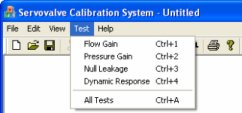
Figure
19. The Test submenu |
The main menu consists of five submenus:
- File: open a new file, open an existing file,
save the current project, export the current
project data to a comma separated value file
(*.CSV), print, open the most recent servovalve
files (*.SVO), or exit the software [Figure
17]
- Edit: cut, copy, or paste
- View: turn on/off toolbar or status bar [Figure
18]
- Test: performs the 4 servovalve tests:
-
Flow Gain, which graphs
the frequency of the flow meters versus
the corresponding current sent to the servovalve
- Pressure Gain, which graphs the analog
output of the pressure transducers versus
the corresponding current sent to the servovalve
- Null Leakage, which graphs the flow rate
versus the corresponding current sent to the
servovalve, but the servovalve ports are blocked
so that no fluid can flow between the C1 and
C2 ports; the flow meter on the servovalve
return port is used to measure the flow that
“leaks” from the valve
- Dynamic Response, measures the response
of a low-mass piston, or
All Tests, which will run all four of the previous
tests individually and in succession [Figure
19]
|
Any test may be selected by the main menu, the toolbar,
or its corresponding keyboard shortcut. The equivalent
test function is then called in the software and a modal
dialog box is displayed with an emergency stop button
until the test is complete. Each servovalve test takes
approximately ten seconds to perform and a graphical
representation of the data will be displayed on the
monitor when the test is complete.
Previously saved projects with completed tests can
also be opened by selecting any existing Servovalve
Calibration System file (*.SVO). An opened file will
show up to four existing tests in the display area where
the username, the servovalve serial number, the time
and date when the test started, and the graphical representations
of the formerly sampled data are shown.
Next
Page - Hardware Interface Development
|
|