| |
Servovalve
Operation
A servovalve is a flow control device that mechanically
controls hydraulic flow over a large range of flow rates
and fluid pressures. A servovalves is controlled by
a small electrical input current signal which causes
the torque motor to rotate a rigid flapper toward one
of the nozzles. The resulting pressure differential
at the two ends of the spool moves the spool to open
or close ports. There is a positional feedback device
called “feedback flex” that returns the
flapper to the center position and balances the forces
on the spool. The system reaches steady-state operation
when the port openings are adjusted such that the fluid
flow through the servovalve matches the flow rate specification
by the electrical input current signal. To summarize,
a servovalve compares the hydraulic flow rate to the
electrical input current signal, and automatically adjusts
the servovalve port openings until the desired flow
rate is achieved. Servovalves respond very quickly to
input current signal, and can have a useable frequency
range of up to 150 Hz.
Servovalve
Tests
The servovalve tests are intended to check for defect
and evaluate servovalve performance. The types of servovalve
test are briefly described. The four general categories
of tests include: (1) Flow Gain: Flow rate versus input
current, (2) Pressure Gain: Load pressure versus input
current, expressed in psi/mA, (3) Null Leakage: Valve
internal leakage flow rate versus input current and
(4) Dynamic Response: Sinusoidal input current of varying
frequency versus the displacement of a low-mass low-friction
actuator. The solenoid valves, shown in Figure 7, can
either be closed or open to change the testing condition.
The servovalve tests that were specified for the project
are the following.
Blocked
Port Pressure
For this test, the solenoid valves
to control ports C1 and C2 are closed. After opening
the solenoid valve in the pressure return line
R, the solenoid valve in the pressure supply line
P is opened. The port abbreviations C1, C2, R,
and P refer to the schematic from Figure 7. Input
current control signal is then swept between plus
and minus rated current values, stopping at zero
input current. For the Pressure Gain plot, load
pressure versus the input current is measured,
recorded, and plotted. Typical Pressure Gain plot
produced from the blocked port pressure test is
shown in Figure 10.
|
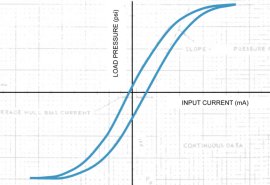
Figure
10. Typical servovalve Pressure Gain
plot
|
The blocked port pressure test simulates an actuator
applying force on a very stiff specimen or performing
a high pressure test on a hydraulic tube or fitting.
Since there is no external device attached to the servovalve,
any anomalous behavior in the hysteresis plot curve
is an indication that there is something wrong with
the servovalve. The blocked port pressure test provides
the clearest indication of a servovalve malfunction,
while the other tests evaluate its performance.
Blocked Port Pressure at Null
At null condition, ports C1 and C2 are blocked but a
small flow is still possible from the pressure port
P to the return port R through the flapper nozzles.
The blocked port pressure at null test can measure the
degree of wear in the valve. An ideal valve has half
the supply pressure on the output ports at null. In
practice this pressure is usually a little higher than
the half pressure point.
Open Port Flow
For this test, the solenoid valves to control ports
C1 and C2 are fully open. Input current control signal
is then swept between plus and minus rated current values,
and the flow meters FM1 and FM2 measures the flow rate
in the hydraulic lines. The flow rate versus the input
current plot can be used to evaluate servovalve performance
such as Flow Gain, linearity, symmetry, hysteresis,
and saturation. The open port flow test simulates an
actuator applying a force on a very flexible and compliant
specimen or position control with minimal load and friction.
Again, since there is no external device physically
connected to the servovalve in the test, any anomalous
behavior is an indication of servovalve malfunction.
Null Leakage
At null condition, there is a small flow from the pressure
port P to the return port R through the flapper nozzles.
The internal leakage flow can be measured using the
flow meter FM3 (shown in Figure 7). The null leakage
test simulates a double-ended actuator holding zero
force. This test can indicate the degree of wear in
the servovalve.
Frequency Response
The frequency response test examines the dynamics characteristics
of the servovalve. The servovalve is a dynamic device
that is frequently used to the full extent of its bandwidth.
Used in conjunction with a feedback signal (such as
position or force), the servovalve can be used to create
a closed-loop servo, controlling the position or force
of an actuator. For servovalves to be used effectively
in closed-loop mechanical systems, their frequency response
must be thoroughly characterized throughout their usable
bandwidth. A servovalve that is stable with a 3,000
psi supply pressure may not be stable when the pressure
is raised to 5,000 psi. The frequency response test
is run with no load (all control ports solenoid valves
opened) and a sinusoidal current input signal is swept
through the servovalve with varying frequencies. A low-mass,
low-friction actuator is used in FRA (shown in Figure
7) attached to a LVDT to measures the displacement of
the actuator. The resulting plots are the Bode magnitude
and phase shift plots. These two graphs plot output/input
amplitude versus input frequency and output/input phase
shift versus input frequency.
It is often not necessary to perform every one of these
servovalve tests. If the performance of a servovalve
deviates from expected behavior in one of these tests,
the servovalve will likely require service from the
manufacturer.
Hydraulic
Power Supply Operation
The United Filco hydraulic power supply is rated at
3,000 psi and 35 gpm. The fluid velocity coming out
of the hydraulic power supply is about 25 fps. ME 5.3
located the necessary hoses and fittings to connect
the hydraulic power supply to the test bench. Hoses
with a 3,000 psi working pressure and 0.75 inch inside
diameter were used to connect the hydraulic power supply
to the test bench. The component testing group primarily
uses a petroleum-based hydraulic fluid. Many components
in commercial aircrafts use Skydrol phosphate-ester
based hydraulic fluid, which meets FAA specifications
for function and safety. Skydrol hydraulic fluid poses
a greater health hazard and is substantially more expensive
than petroleum-based fluids. ME 5.3 used a petroleum-based
Mobil DTE 25 hydraulic fluid for the servovalve calibration
project.
Sensors
and Control Hardware
The test bench is equipped with four types of measuring
devices. There are three Cox internal turbine flow meters
(FM1~3), two Sensotec A-5 series pressure transducers
(PT1~2), a linearly variable differential transducer
(LVDT) for frequency response test, and a Ohio Semitronics
current transducer that measures the control signal
to double check the input current signal.
Flow meters FM1 and FM2 measures the flow rate in the
+ Flow and the – Flow line. The internal turbine
flow meter (Cox Model ANC 16), shown in Figure 11, outputs
a digital pulse train at 10 VDC. The frequency of that
pulse train signal corresponds to the amount of fluid
flow through the body of the flow meter. It is shown
that the flow rate ranging from 0 to 60 gpm corresponds
to pulse train signal frequency of 0 to 1400 Hz. A separate
and different flow meter FM3 (Cox Model ANC 8-4) is
used to measure the leakage flow rate.
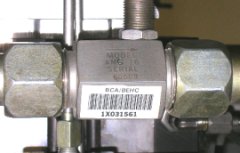
Figure
11. Cox internal turbine flow meter
|
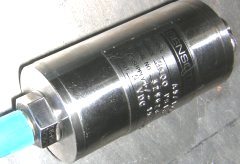
Figure
12. Sensotec pressure transducer
|
Pressure transducers PT1 and PT2, shown in Figure 12,
are linear analog voltage devices with output voltage
proportional to pressure. The Sensotec A-5 Gage series
pressure transducer, shown in Figure 10, is rated at
5000 psi and outputs 0-5 VDC. LVDT and the current transducer
are also both linear analog voltage devices with output
voltage proportional to displacement and current, respectively.
The current transducer will be discussed in more complete
detail in sections on hardware interface development.
For controlling the
servovalve tests, five normally closed Parker
solenoid valves (SOL1~5), shown in Figure 13,
manage the flow of hydraulic fluid through the
test bench. By selectively open and close solenoid
valves, the user can configure the test bench
for any of the required servovalve tests. For
subsequent data acquisition, ME 5.3 obtained pin-out
diagrams for the pressure transducers and the
flow meters.
|
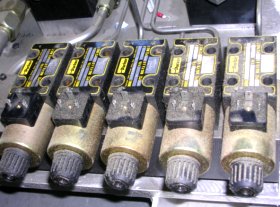
Figure
13. Parker solenoid valves
|
National
Instruments DAQ Card
Boeing required ME 5.3 to use a National Instruments
(NI) DAQ card for the servovalve calibration project.
ME 5.3 narrowed its search to two models, an older E-Series
and a new M-Series model DAQ card. After researching
the advances in NI DAQ cards and consulting with our
liaison engineer, a NI-PCI 6221 M-Series DAQ card was
chosen for the project. The M-Series cards support all
of the functions needed for the project and cost less
than the E-Series cards. Since the M-Series cards are
relatively new, ME 5.3 reviewed the technical documentation
extensively. The M-Series DAQ card supports C++, LabView,
Visual Basic, and Microsoft .Net programming languages.
The specifications of the NI-PCI 6221 are tabulated.
Two
16-bit analog outputs (833 kS/s)
NI-MCal calibration technology
NIST-traceable calibration certificate
NI-DAQmx Measurement Services to simplify configuration
&measurements
Correlated DIO (8 clocked lines, 1 MHz)
24 digital I/O; 32-bit counters; digital triggering |
ME 5.3 also selected NI BNC 2090 DAQ breakout
panel, shown in Figure 12, since it has the same pin
capabilities and supports all the functions of the NI-PCI
6221 M-Series DAQ card. A breakout panel is easier to
use than hooking up wire leads directly to the DAQ card.
The BNC-2090 is a shielded, rack-mount adapter with
signal-labeled BNC connectors, spring terminal blocks,
and component locations for passive signal conditioning.
The BNC-2090 consists of 22 BNC connectors (18 analog,
2 digital, and 2 user-defined), a 68-pin male connector,
and 28-spring terminals to provide easy connection.
The panel also has signal conditioning capabilities
(simple passive, low pass or high pass filter, voltage
attenuator circuits).
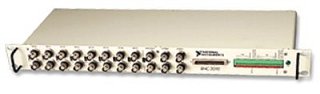
Figure
12. BNC 2090 DAQ breakout panel
Software
In the Request for Proposal, Boeing requested a Windows-based
software for the control and data acquisition portion
of the Servovalve Calibration Project. C++ was selected
as the programming language since it is fully supported
by the M-series DAQ card and is a common programming
language. During the research phase of software development,
National Instruments provided extensive documentation
and example programs to demonstrate the capabilities
and codes recognized by the DAQ card. In addition, other
C++ programming books were referenced in order to gain
sufficient knowledge and skills to explore the full
potential of the DAQ card.
Install
and Test DAQ and Breakout Panel
The installation of the NI DAQ card was straightforward,
due primarily to NI’s extensive support for their
DAQ card and breakout panel. NI measurement devices
and application software NI-DAQ 7.x was installed on
the computer. The software includes two NI-DAQ drivers:
NI-DAQmx and traditional NI-DAQ. These drivers have
an Application Programming Interface (API) which includes
a library of functions, classes, and properties for
creating applications. NI-DAQmx is used with Windows
2000/NT/XP, LabVIEW, Measurement Studio 7.x, or Measurement
Studio .Net.
Since a computer was used for the project, ME 5.3 selected
a Peripheral Component Interconnect (PCI) card. PCI
is a local bus standard developed by Intel Corporation
which connects directly to the microprocessor. This
is not to be confused with PCI-X (PCI extended) which
is an enhanced version of PCI and was designed jointly
by IBM, HP and Compaq to increase performance of high
bandwidth devices. The NI-PCI-6221 card is installed
into a PCI slot in the computer.
The BNC-2090 breakout panel comes ready to use. The
break out panel was installed on the equipment rack
under the computer and then connected to the card using
a SHC68-68-EPM cable. The SHC68-68-EPM cable is an extended
performance shielded cable designed specially for the
M-Series DAQ card that allows connection to standard
68-pin accessories. The application software automatically
installed the software Measurement & Automation
Explorer (MAX) to confirm, test, and configure the NI-DAQ
card settings. MAX also has its own software-based test
panel for troubleshooting the DAQ card.
Next
Page - Software Development
|
|