| |
BACKGROUND
Boeing Commercial Airplanes is a major supplier of
commercial aircraft flown throughout the world. The
complexity of modern aircraft necessitates Boeing to
have large component testing facilities. The high load
and the high rate at which the loads are applied required
the use of hydraulically powered systems. To accurately
control these hydraulic powered systems, servovalves
are used in many aircraft component testing applications.
Servovalves are high power-gain mechanical flow control
devices that operate on a small electrical input current.
The servovalve input current control signal is approximately
50 mA max, while the hydraulic output can be as high
as 3000 psi at 35 gallons per minute (gpm). The fluid
flow rate through a servovalve is approximately linearly
proportional to the electrical input current control
signal. For a mechanical device that delivers such large
fluid flow, a servovalve has a significant bandwidth,
capable of operating up to 150 Hz.
A cut-away view of a Moog 30 Series
servovalve is shown in Figure 1. The input control
current through the electromagnetic coil (motor
coil) creates forces at the ends of the armature,
causing the torque motor to move the rigid flapper
assembly toward one of the nozzles. The movement
of the flapper between nozzles creates a pressure
differential between the two ends of the spool
(shown in Figure 2).The spool then moves and opens
the pressure port (P), control ports (C1 and C2),
and the return port (R), allowing hydraulic fluid
to flow through the servovalve (shown in Figure
3).
|
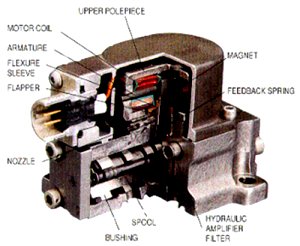
Figure
1. Servovalve
cut-away view
|
The build-up of load differential pressure
creates a feedback force on the spool. Since a servovalve
controlled hydraulic actuator can produce an extremely
large and damaging load, it is imperative that the servovalves
perform accurately to their specifications.
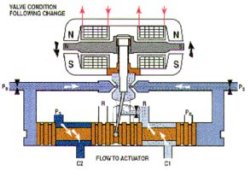
Figure
2. Torque
motor moves
rigid flapper assembly
|
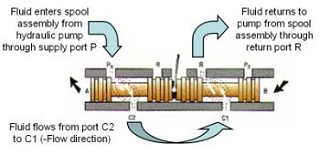
Figure
3. Hydraulic
fluid flows
through the servovalve
|
Boeing donated a United Filco high-capacity
hydraulic power supply to Seattle University for use
in this project. The partially completed servovalve
test bench and a Windows-based computer system were
also provided for use throughout of the project. The
goal of the project was to integrate these components
into a fully-functional servovalve testing and calibration
system. Figure 4 shows the general overview of the calibration
system. The servovalve under test is placed on the servovalve
test bench while a computerized data acquisition and
control system controls and acquire data from the servovalve
tests. The specific tests and components will be discussed
in later sections.
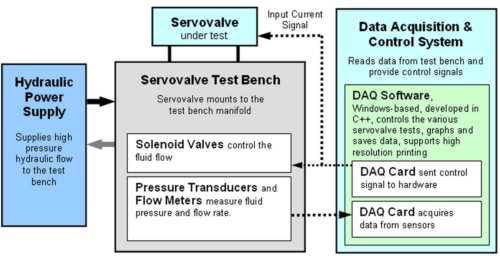
Figure
4. Servovalve calibration system overview
1.
Hydraulic Power Supply
Boeing donated a United Filco high-capacity hydraulic
power supply, shown in Figure 5, to Seattle University
for use in the development of a servovalve calibration
system. The hydraulic power supply, weighing 3,000 pound
and occupying a floor footprint of 4’ by 8’,
had an electrical requirement of 440 V at 88 A (38.7
kW). ME 5.3 transported the hydraulic power supply from
Boeing’s facility to Seattle University. An electrical
power supply and connectors (rated 480 V at 200 A) were
special ordered and installed for the project. The hydraulic
power supply is capable of delivering a line pressure
of 3,000 psi and a sustained flow rate of 35 gpm.
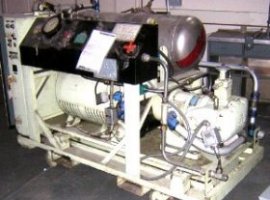
Figure
5. The
hydraulic power supply
|
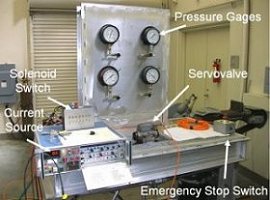
Figure
6. Servovalve test bench
|
2.
Servovalve Test Bench
ME5.3 also transferred the 850 pound servovalve test
bench to Seattle University. It has never been pressurized
or tested at Boeing. ME 5.3 completed leak tests on
all hydraulic fittings and troubleshot the equipment
for subsequent use. A photograph of the top portion
of the servovalve test bench is shown in Figure 6.
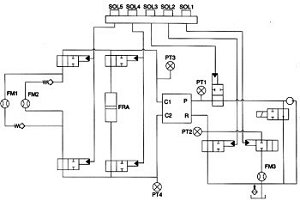
Figure
7. Servovalve
test bench schematic
|
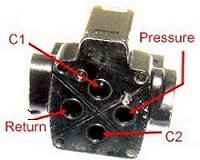
Figure
8. Servovalve ports
|
A schematic diagram of the test bench is also shown
in Figure 7. The solenoid valve bank SOL1~5 (top of
the figure) in Figure 7 manages the direction of fluid
flow to and from the servovalve. Three flow meters measure
flow rates in the lines. The three flow meters are marked
as FM1, FM2, and FM3. As indicated on the schematic,
the flow meters measure the lines “+Flow,”
“-Flow,” and “Leakage Flow”
respectively. Two pressure transducers, marked PT1 and
PT2, monitor pressures in the “pressure supply”
line P and the “pressure return” line R.
Two other pressure transducers PT3 and PT4, shown in
the schematic, are not physically attached to the testing
bench. Frequency response actuator (FRA) features a
low-mass and low-friction piston that moves with cyclic
alternating pressures at its ends.
Attached
to a linearly-variable differential transducer
(LVDT), the FRA is used to determine the useable
range and the frequency response of servovalve
controlled hydraulic actuator. The four-port servovalve
manifold is shown at the center of Figure 5. Ports
leading to pressure supply line (P) and return
line (R), as well as the two control ports (C1
and C2) are clearly marked. The manifold on the
test bench adhere to the standard manifold geometry.
The reciprocating ports on the servovalve are
shown in Figure 8. Ports leading to pressure supply
line (P), return line (R), as well as the two
control ports (C1 and C2) are clearly marked in
the identical manner as those on the test bench.
3.
Computer System
Boeing provided ME 5.3 with all the necessary
computing equipment and software for the project.
A rack-mounted Pentium 4 computer system with
Windows XP Professional operating system, along
with Microsoft Visual Studio, was used to develop
the control and data acquisition software. The
National Instruments data acquisition card (DAQ),
installed in the computer, provided analog and
digital inputs and outputs for data acquisition
and control of the servovalve calibration tests.
The near-completed computer rack, with the computer,
hardware interface, and DAQ breakout panel is
shown in Figure 9. |
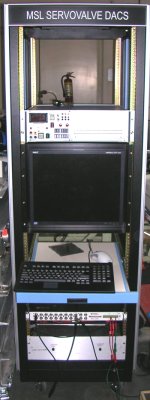
Figure
9. Data
acquisition
and control system
|
Next Page
- Research
|
|